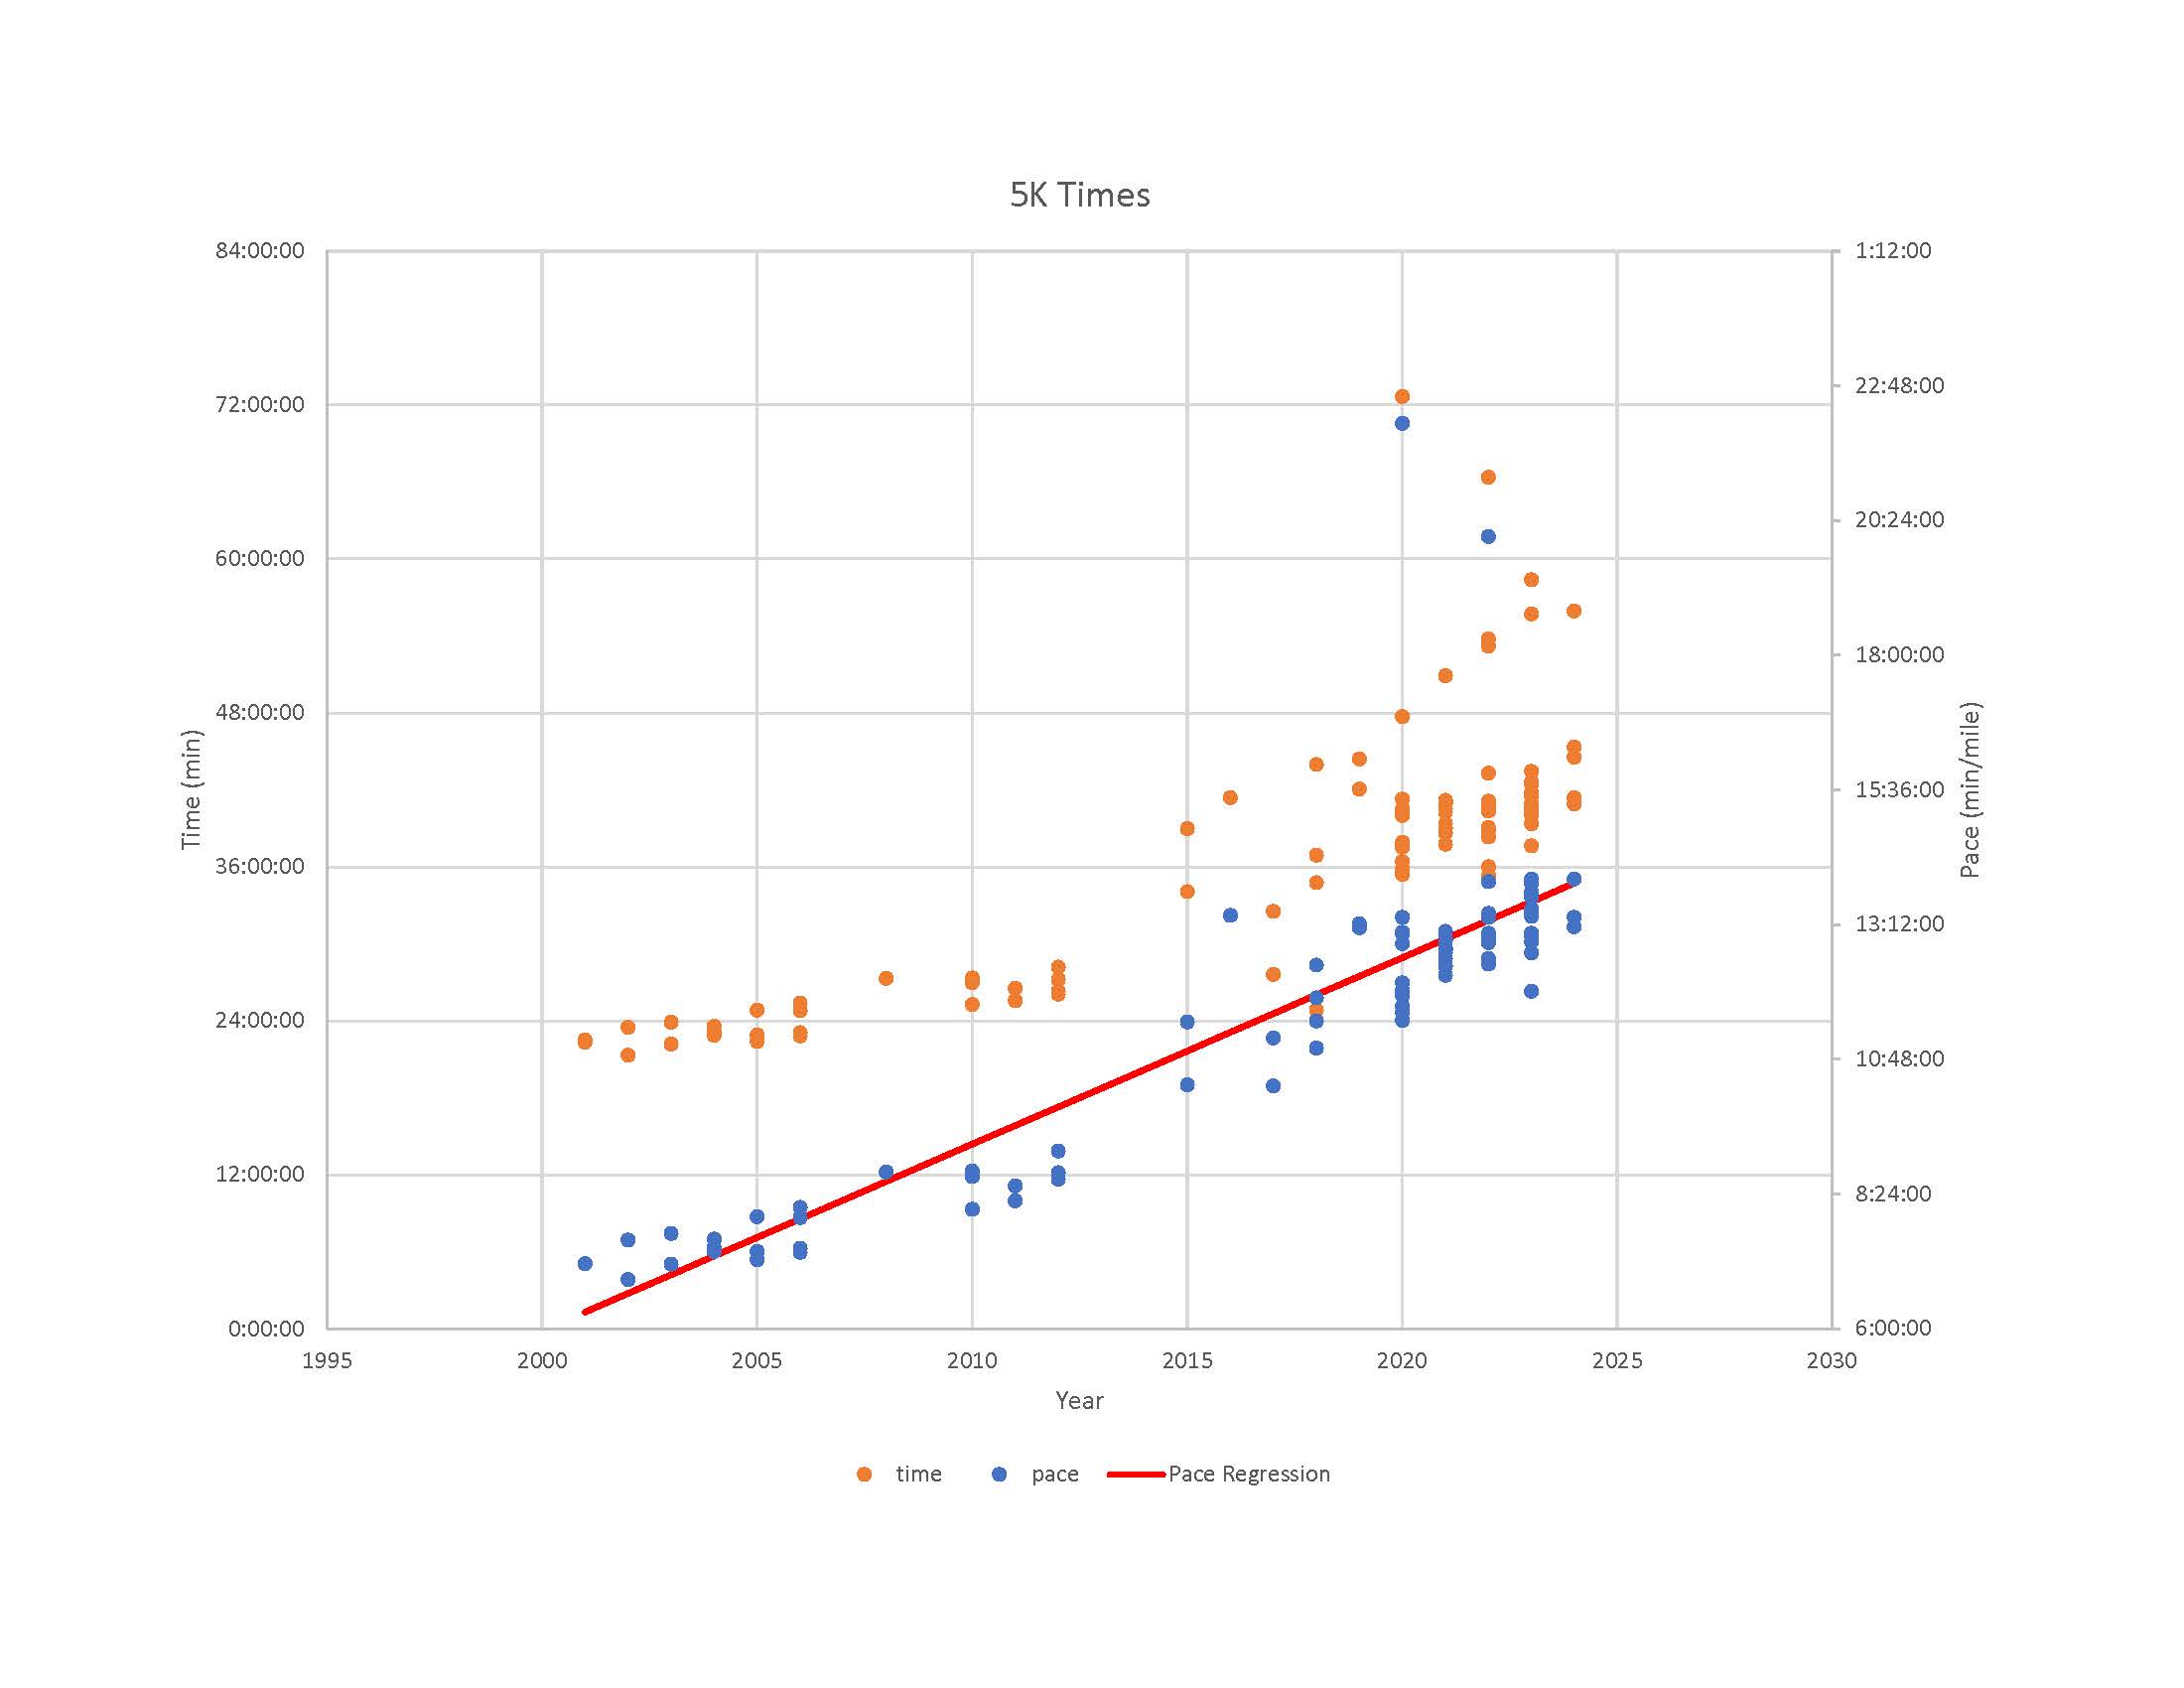
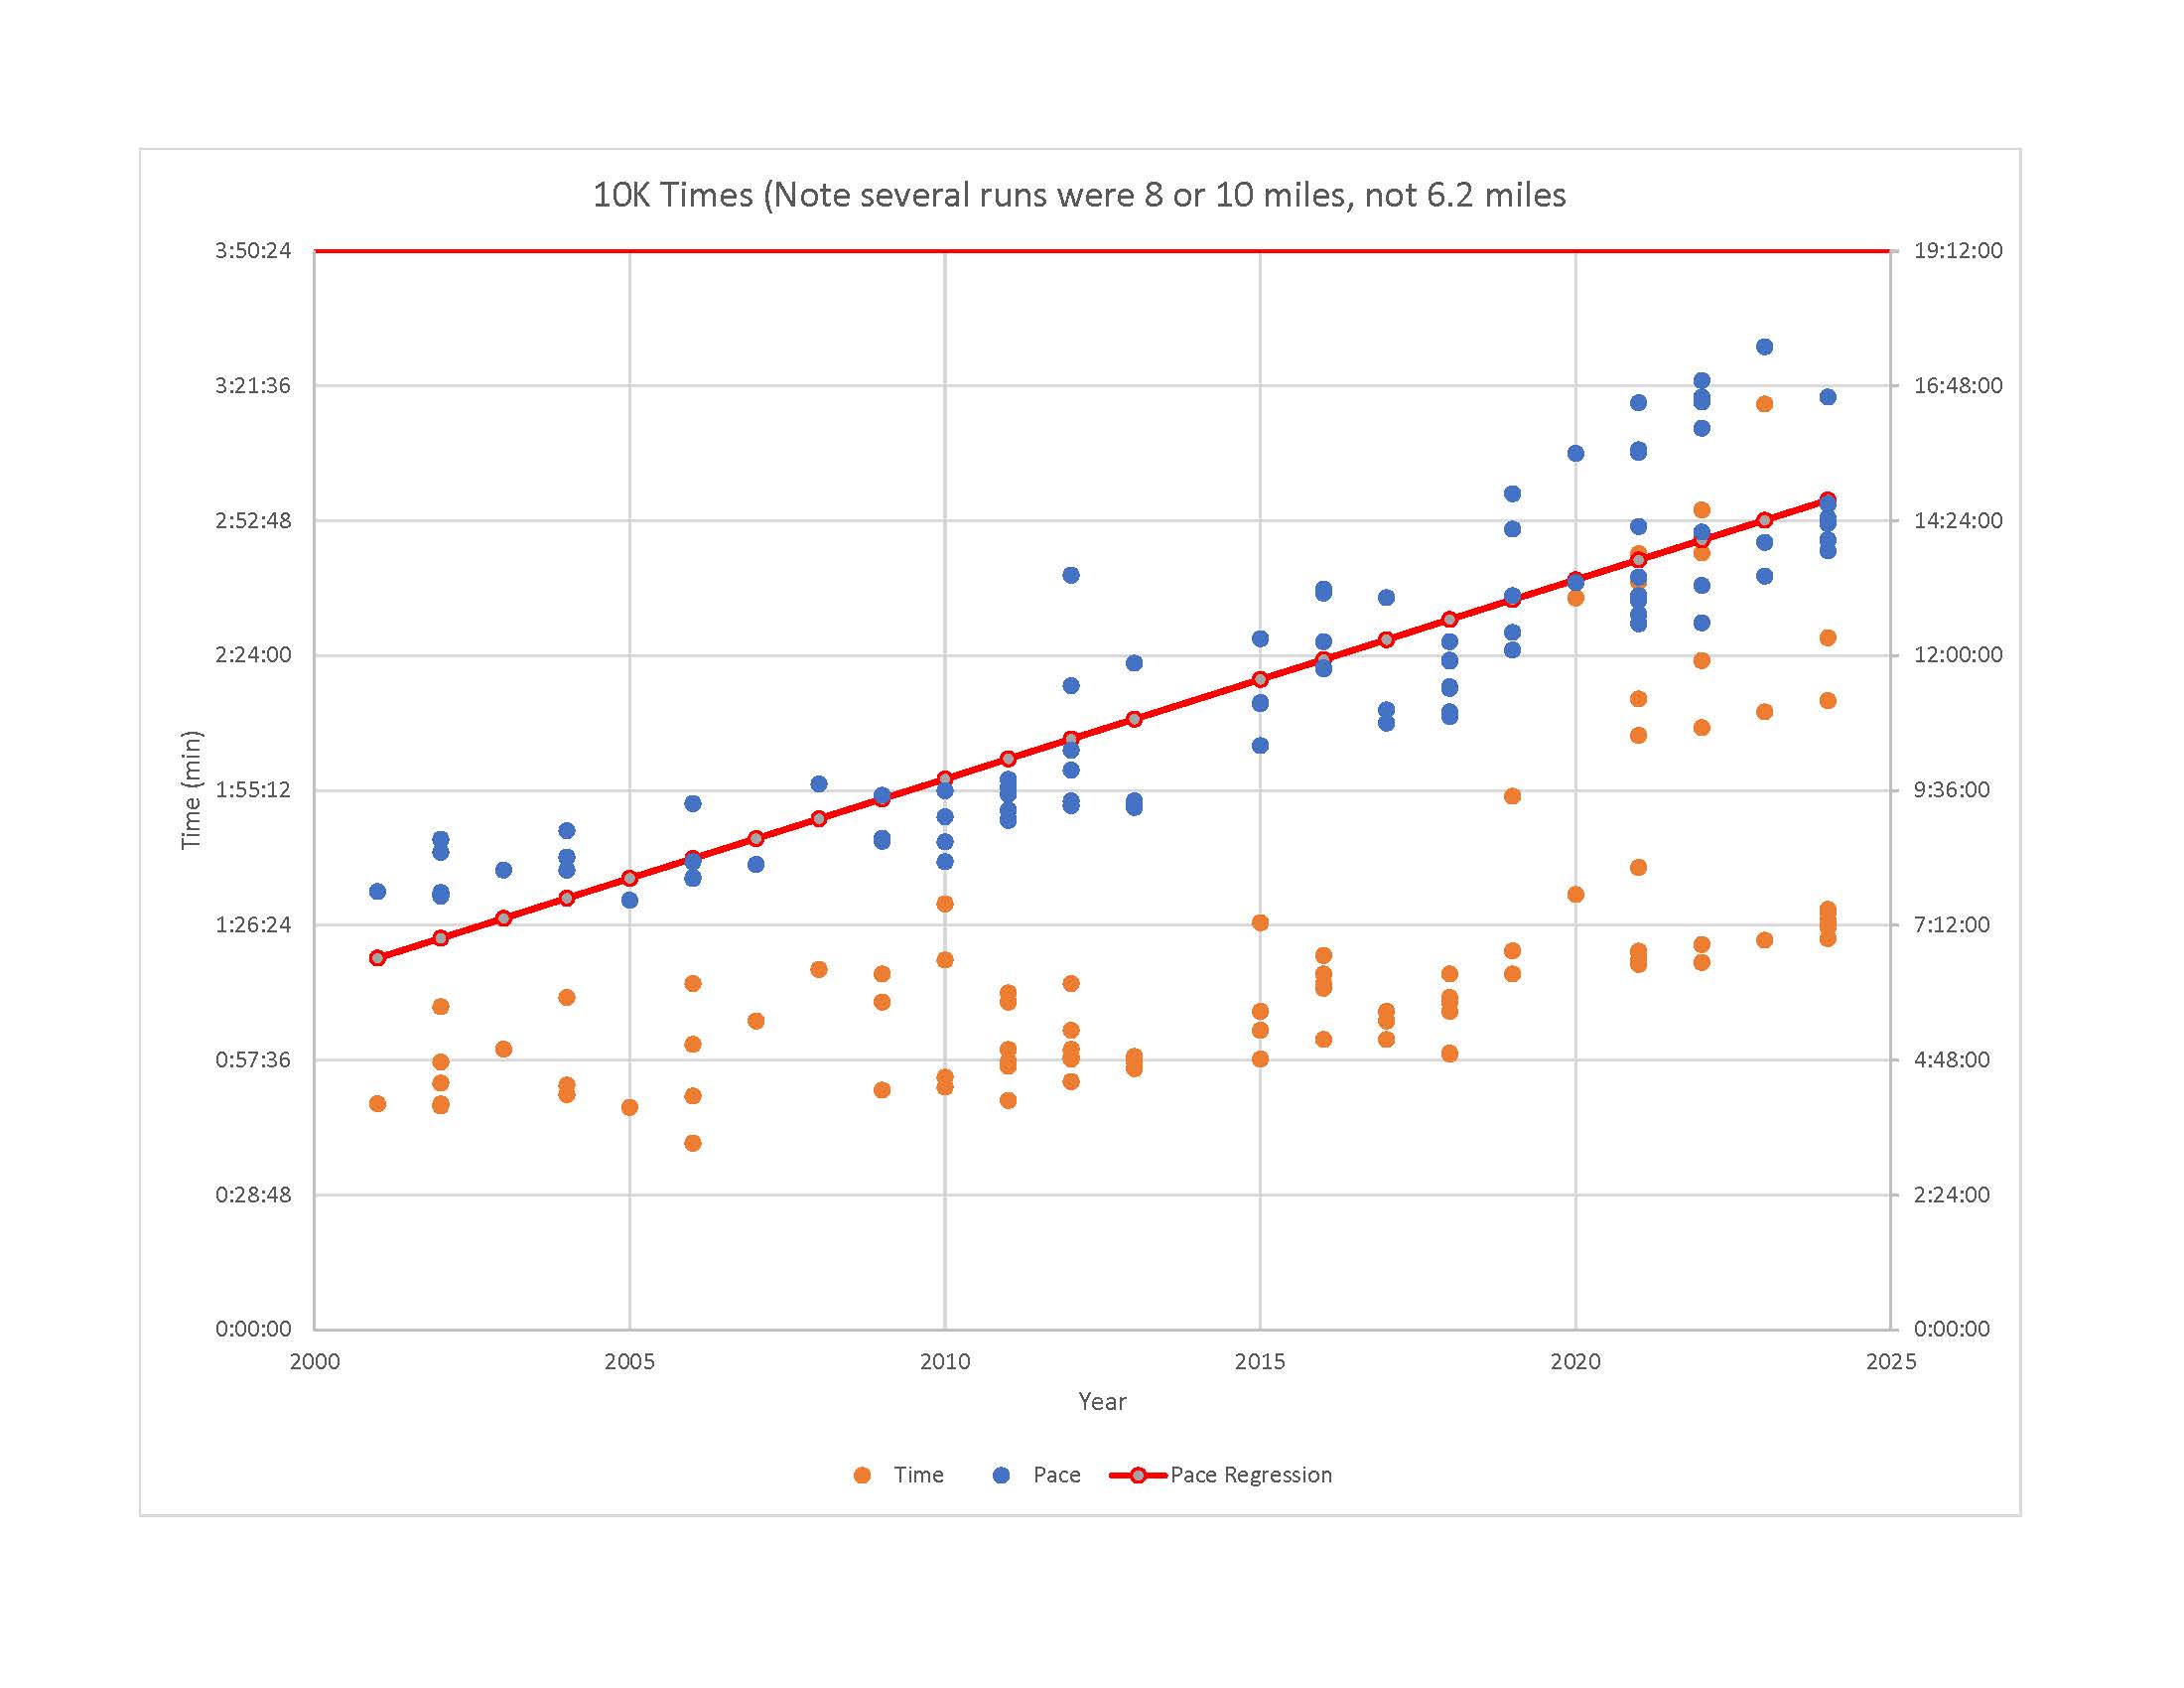
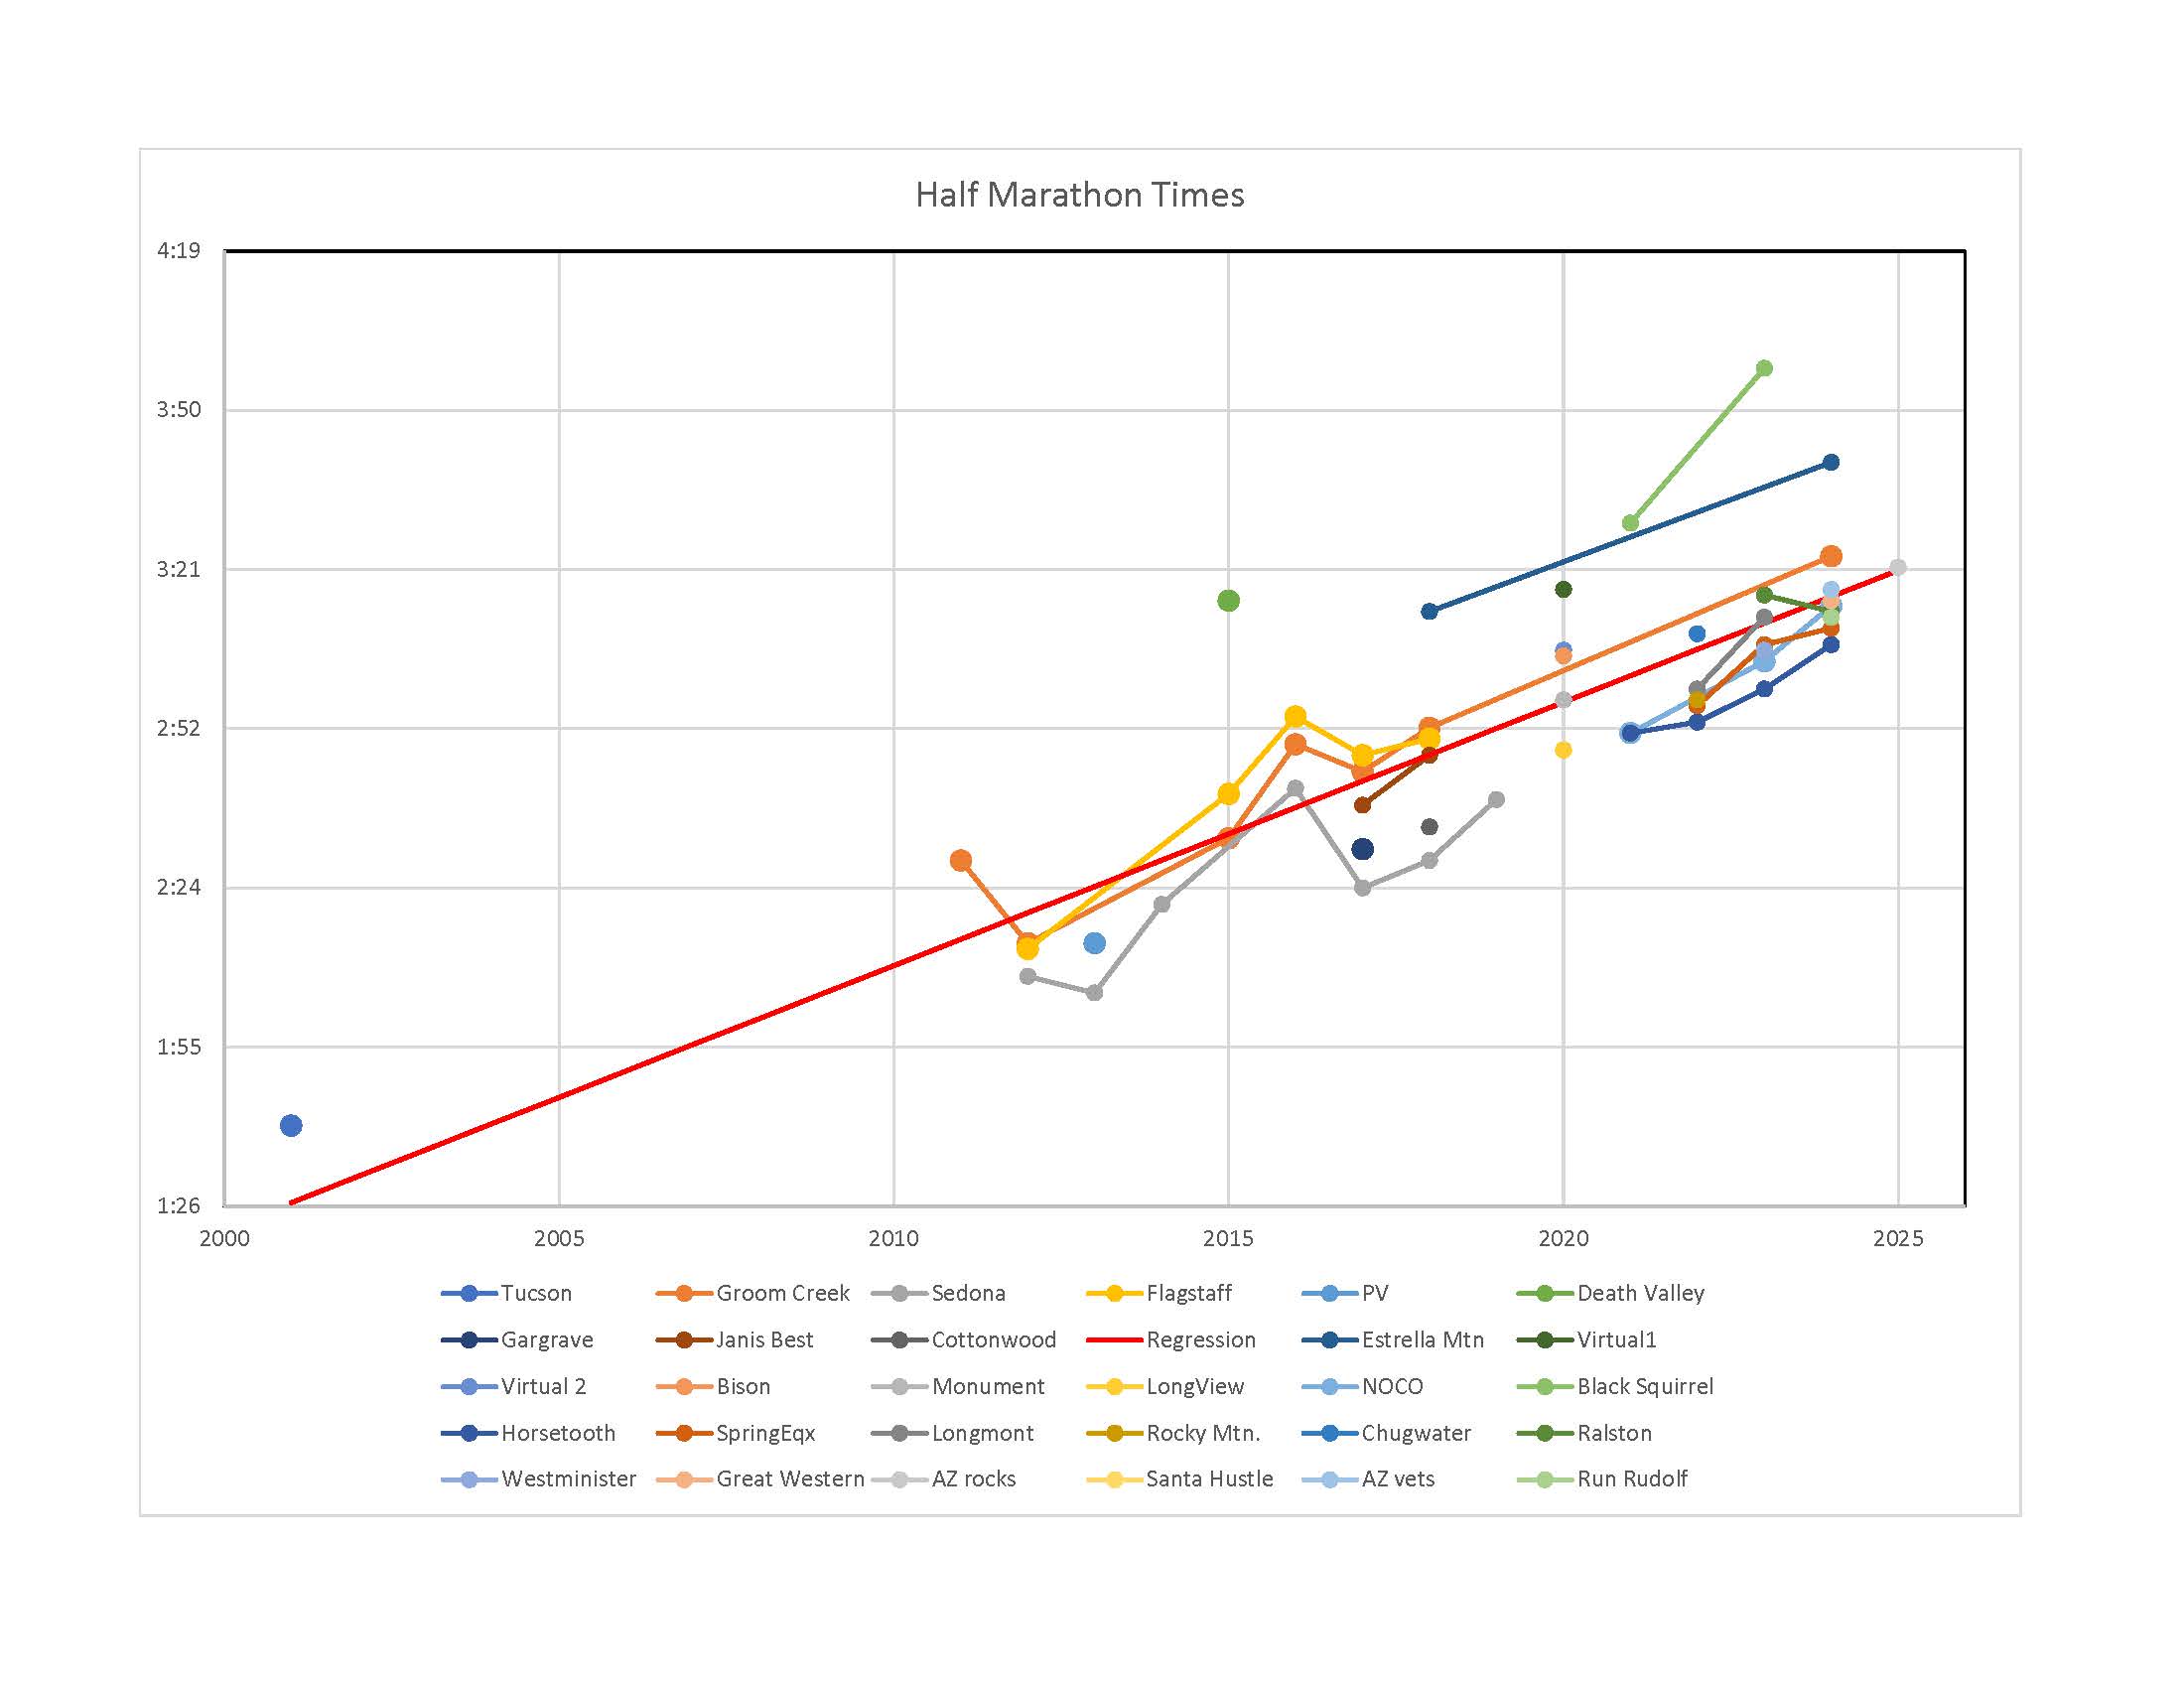
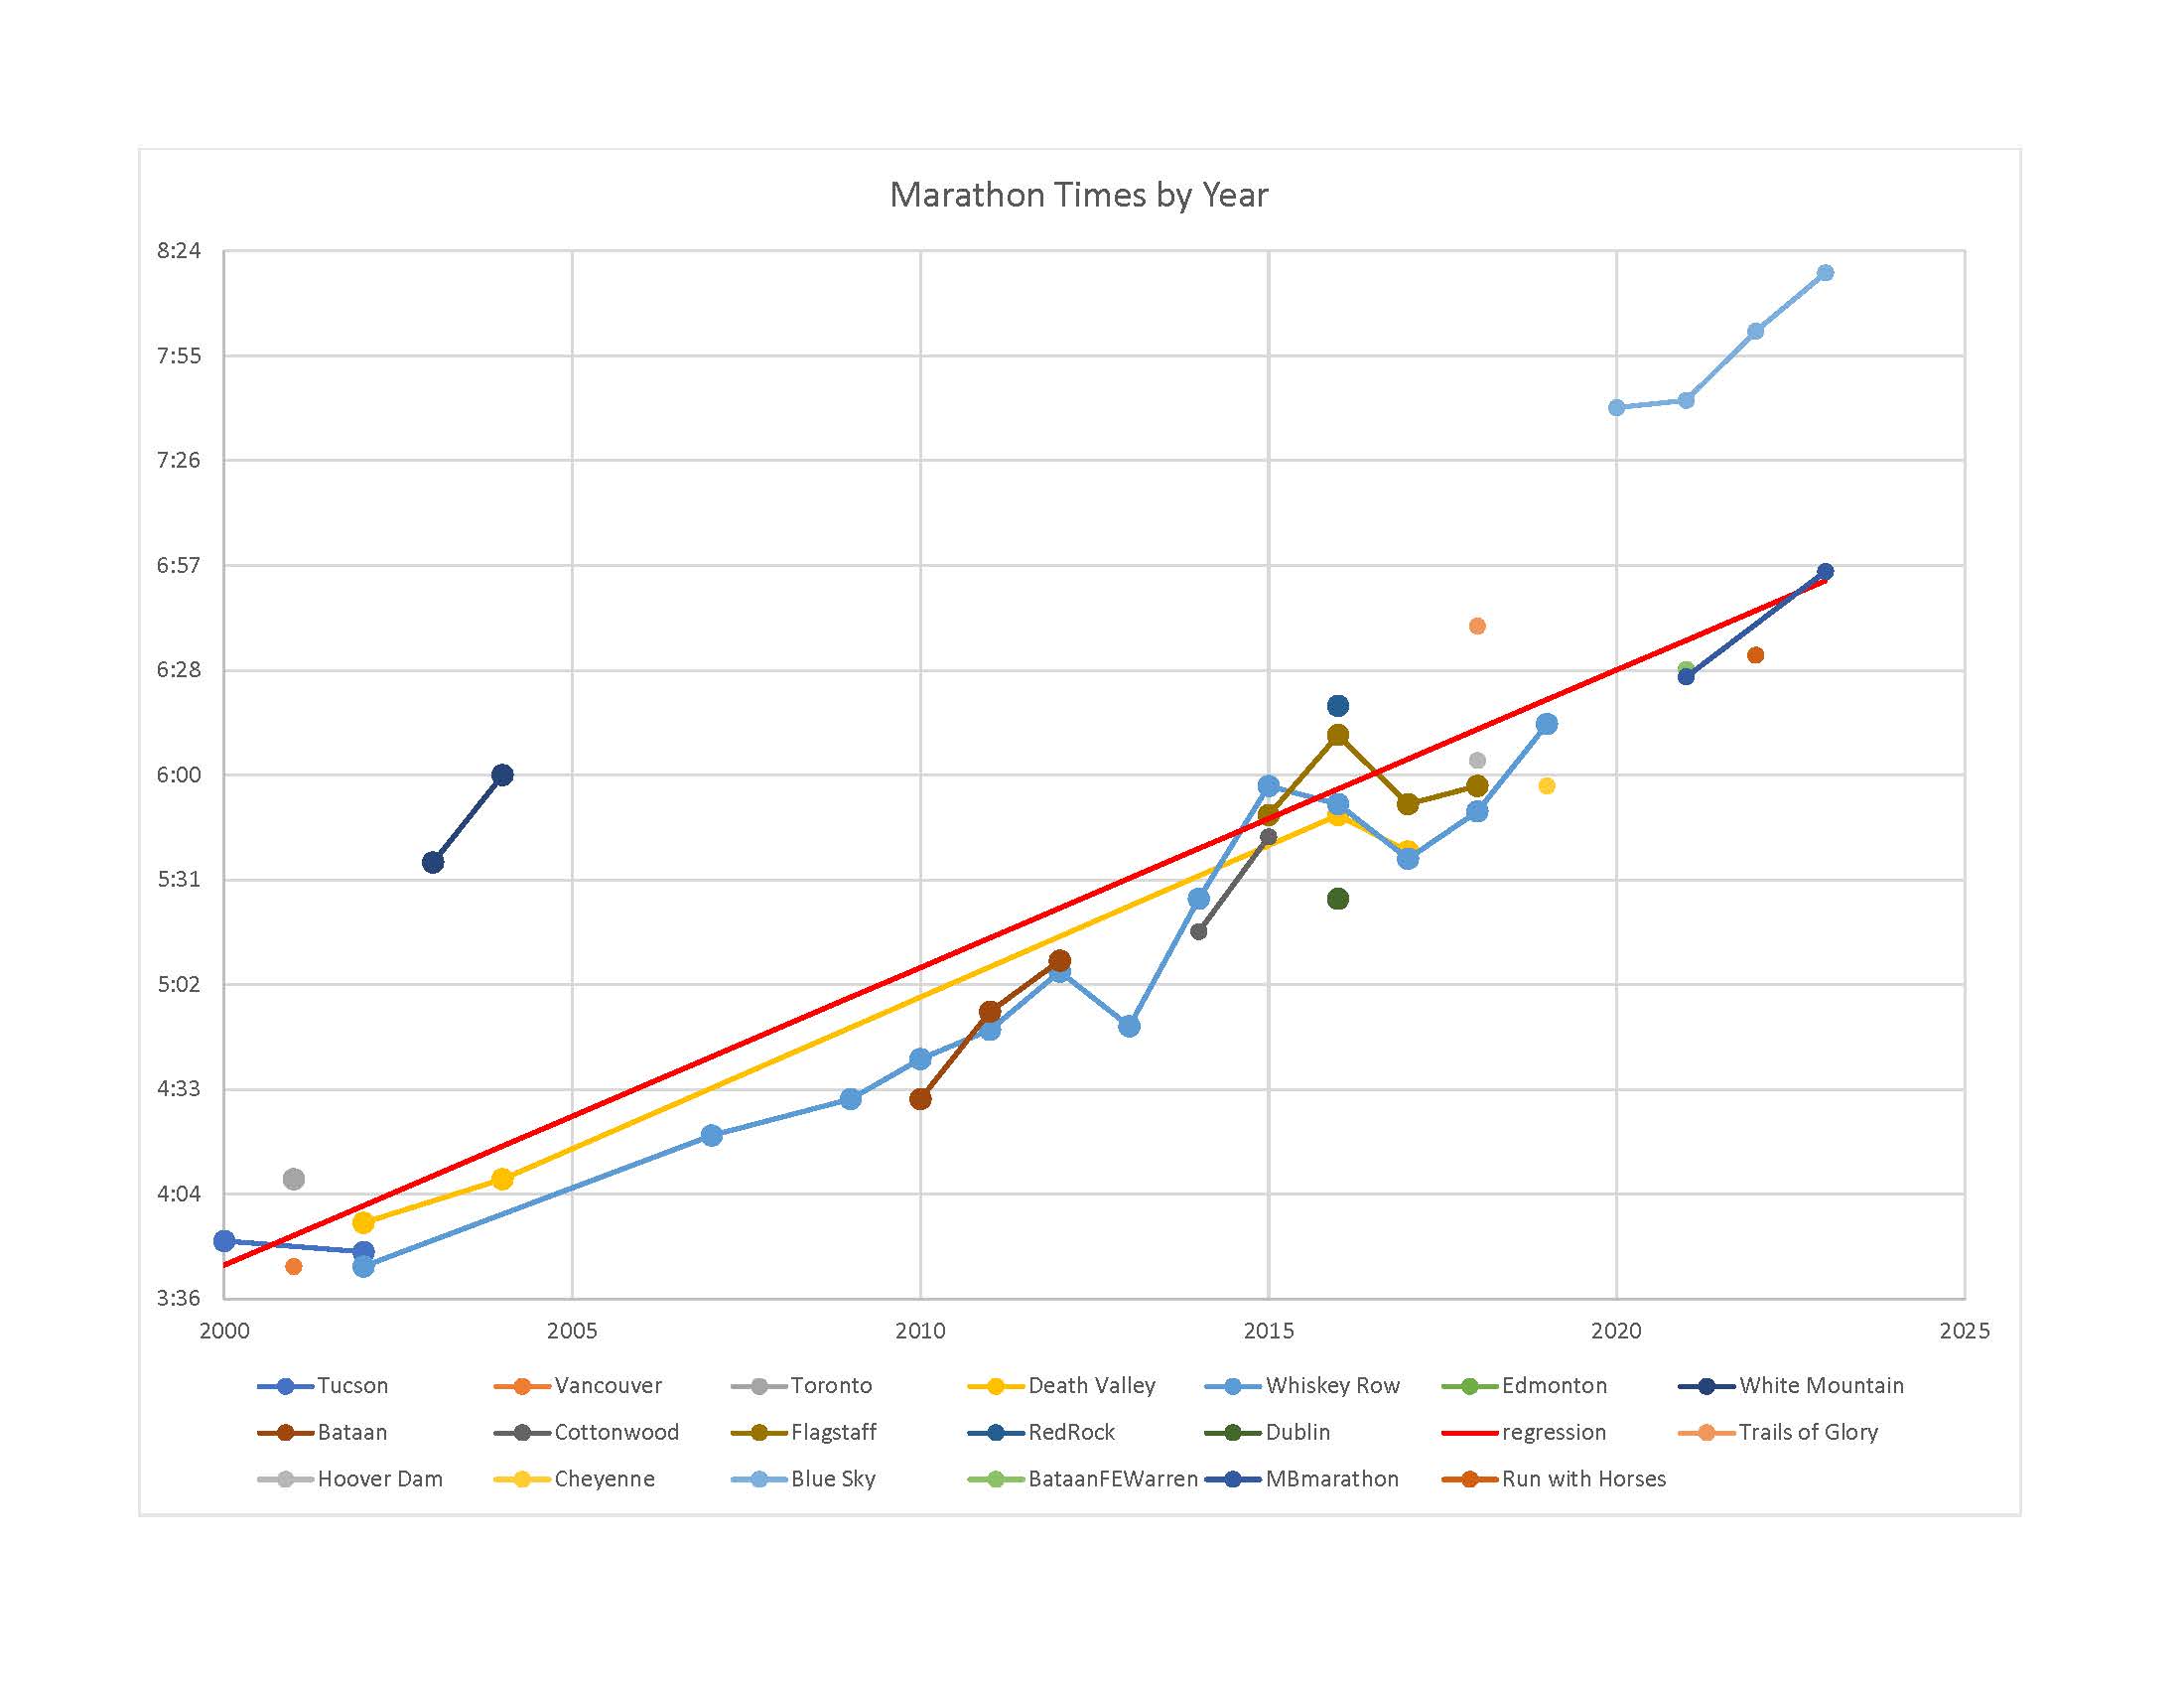
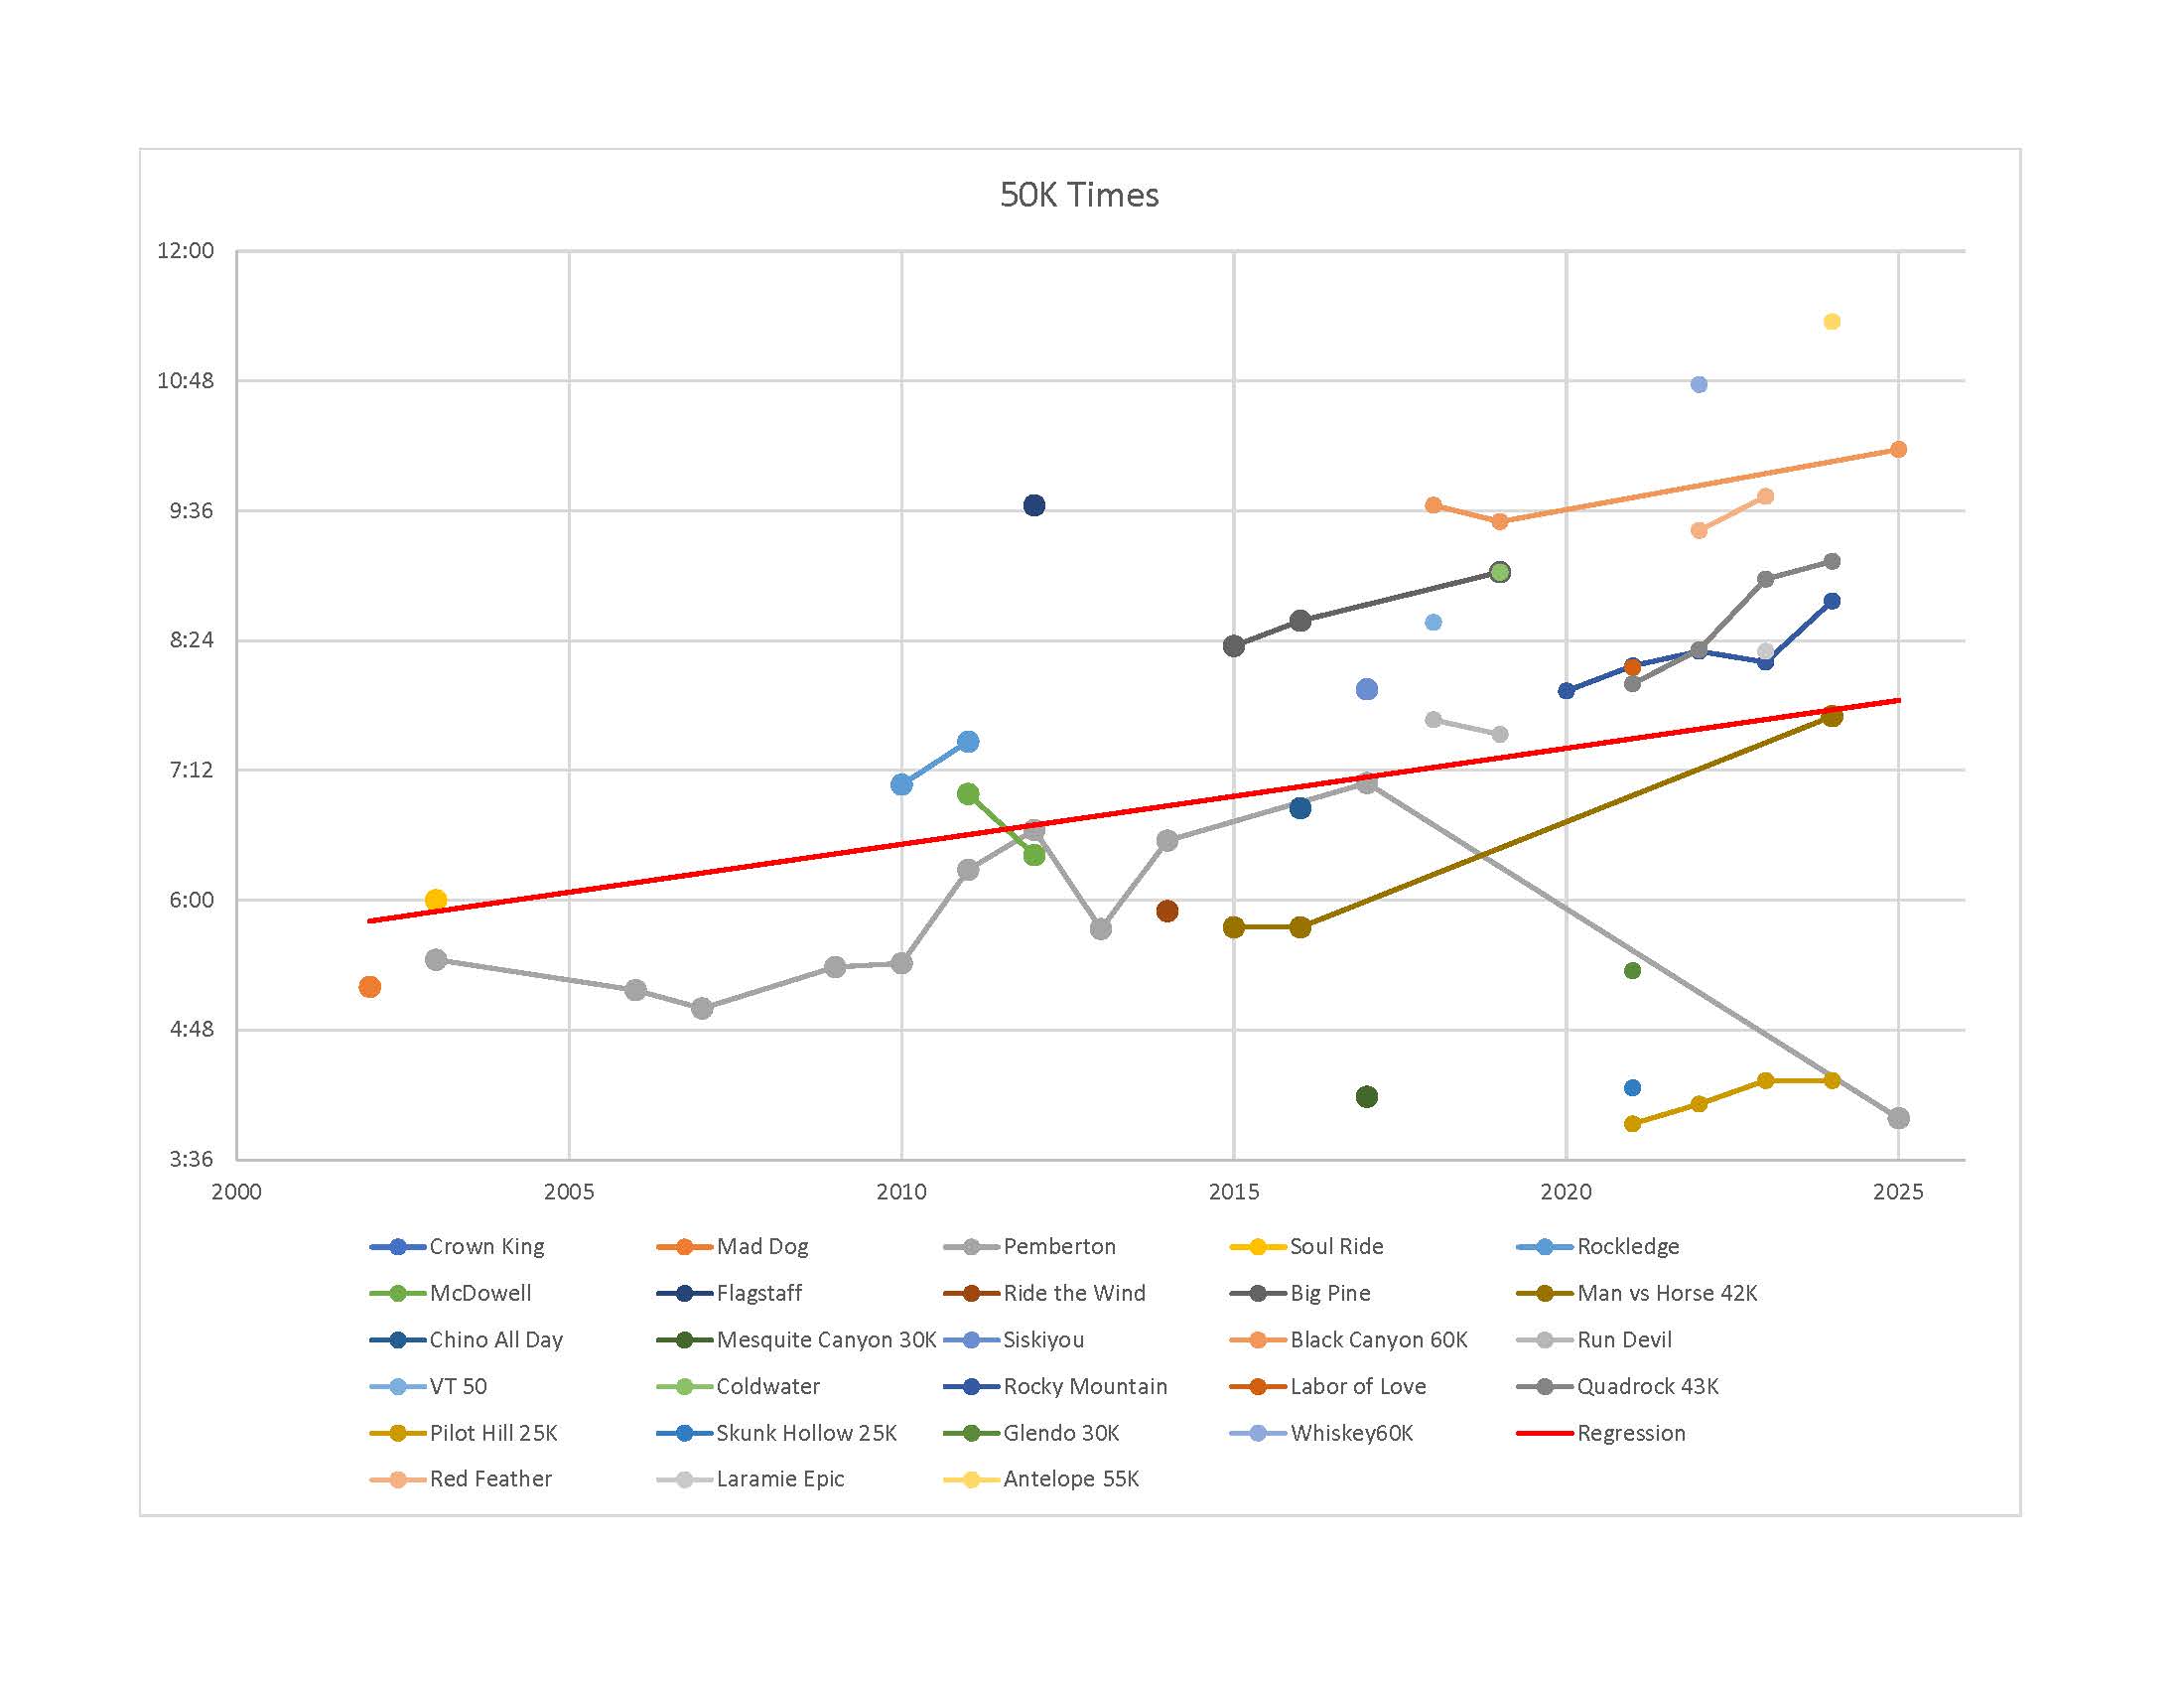
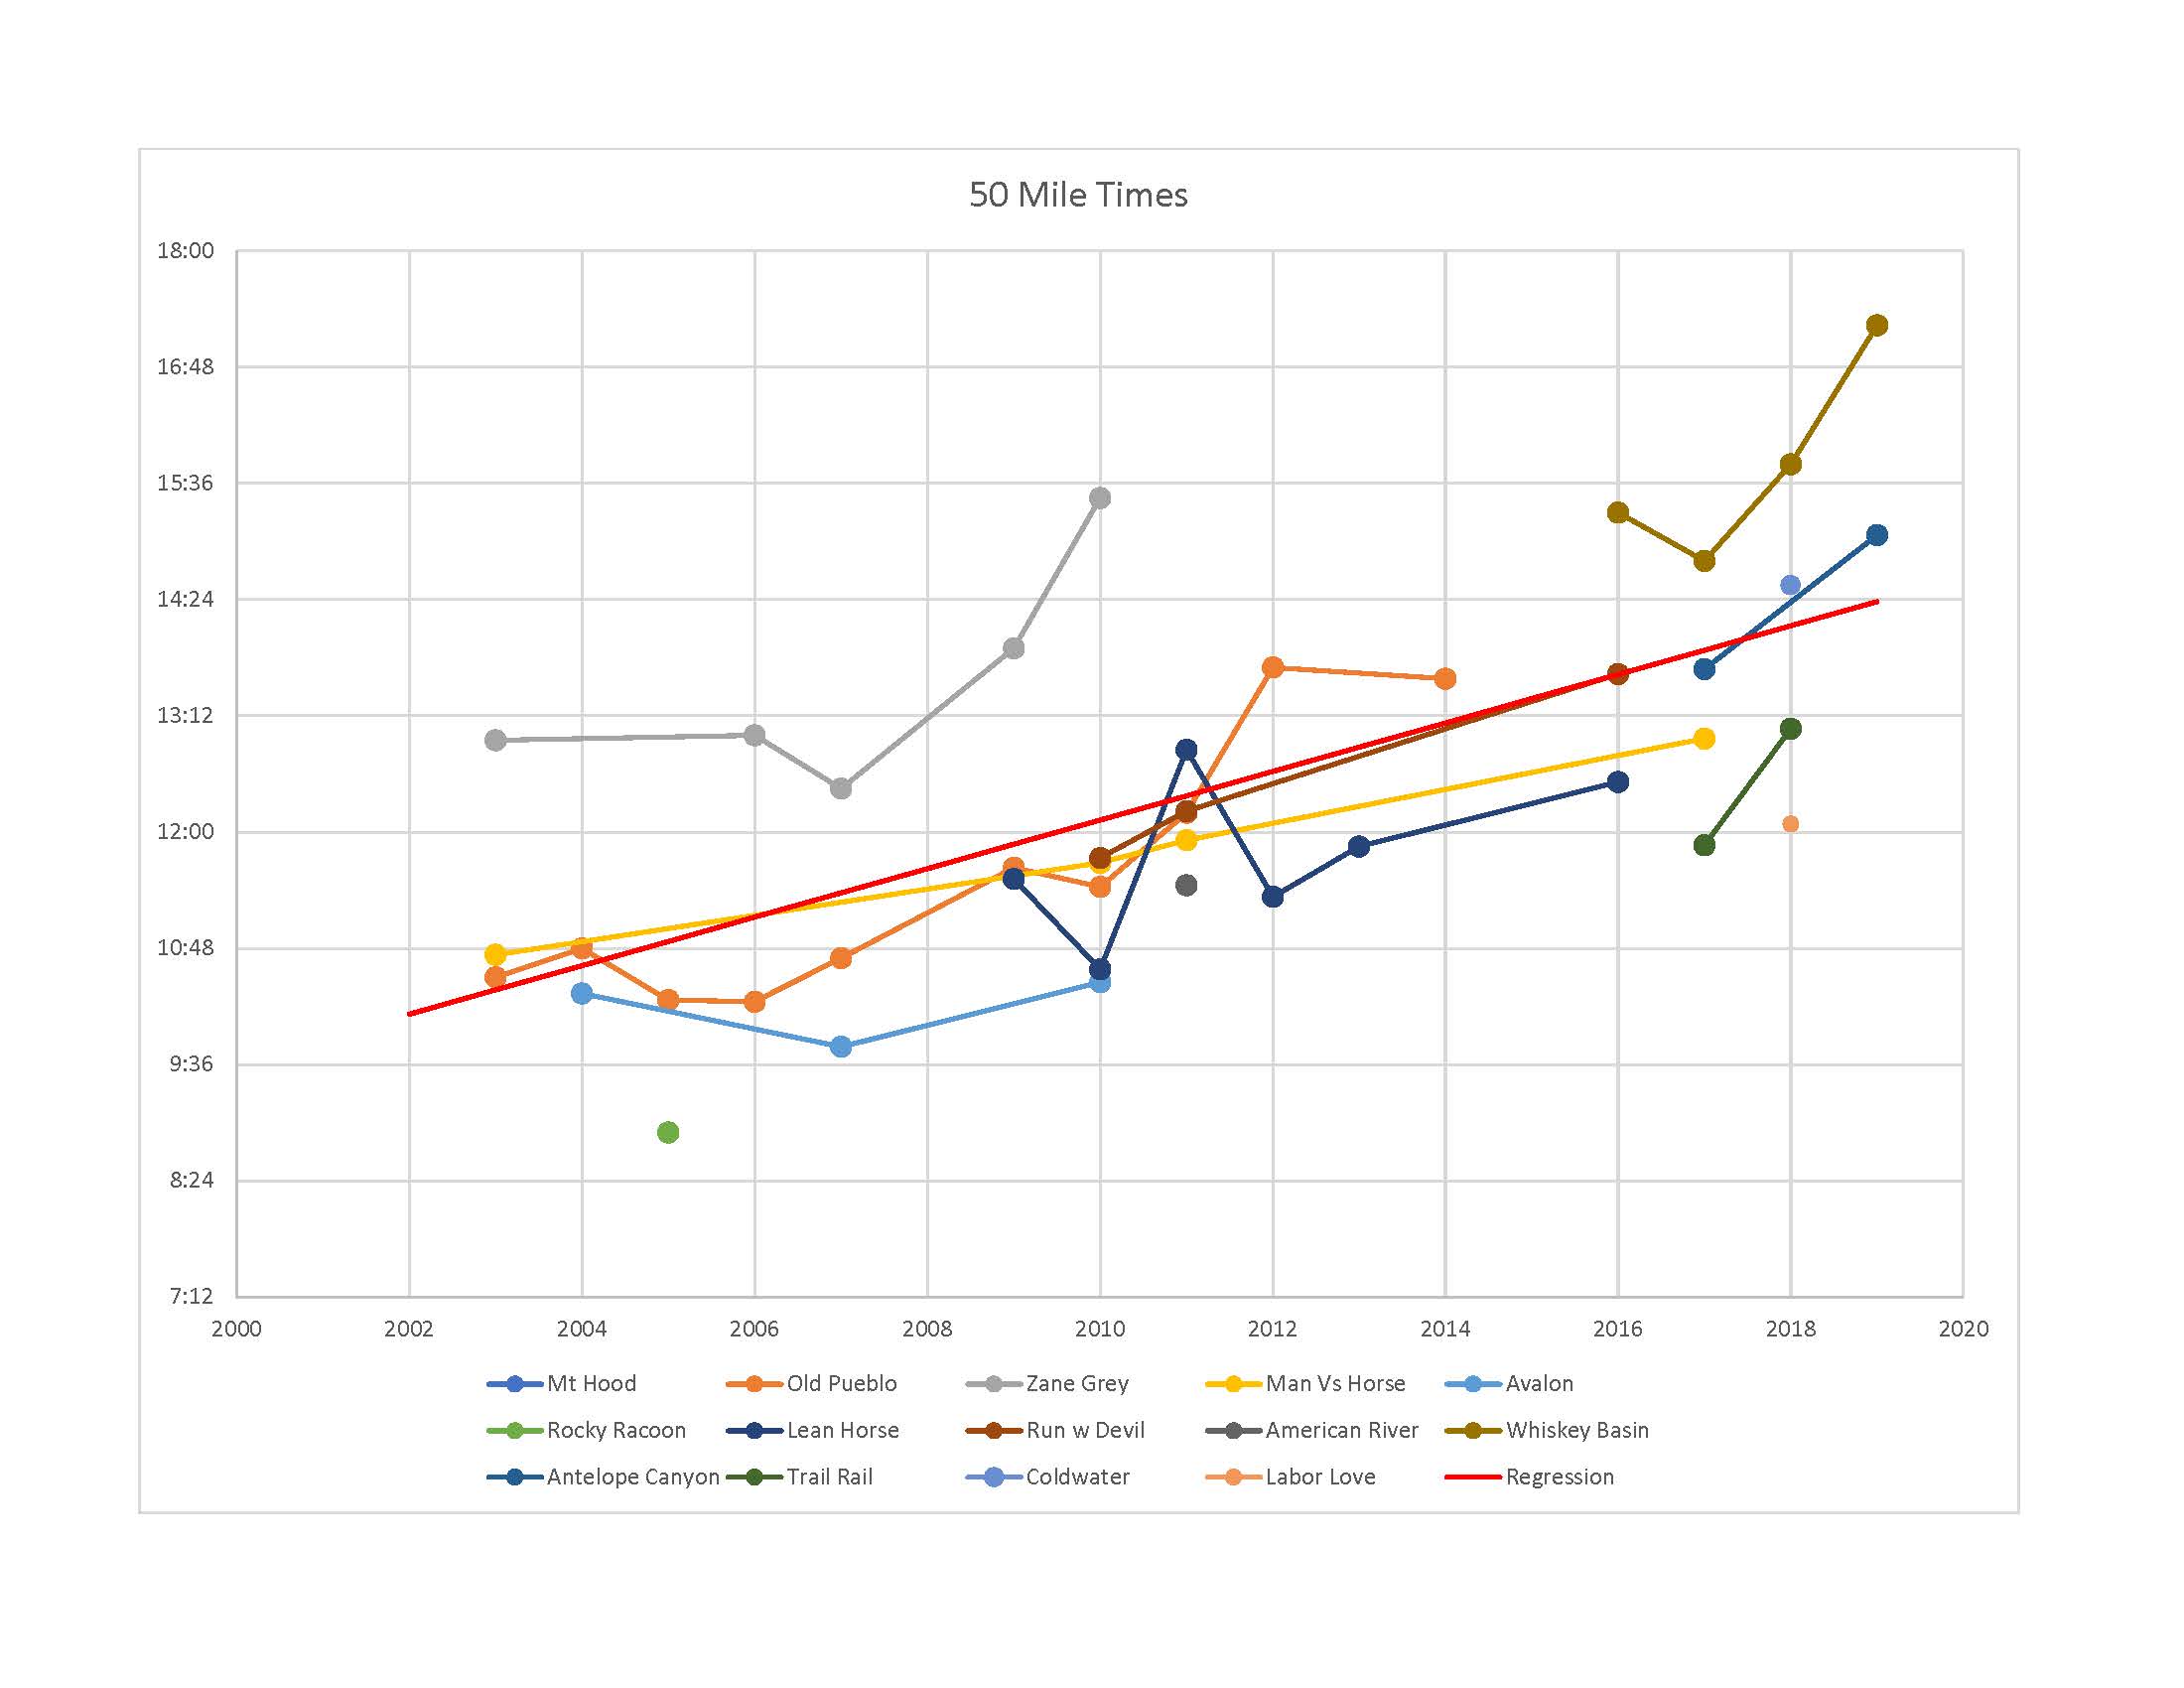
The graphs below present finish times for the races I have run.
They are presented from shortest to longest.
There are linear regression lines shown on each plot which give the general trend of my degrading performance.
100 milers and 100Ks are not included since there are few of them (10 and 6 respectively).